| About Project |  |
||
| Mandate | |||
| Agroclimatic Information | |||
| Research Activities and Achievements | |||
| Contact Information |
About Project |
|
|
Understanding relations between weather and crop production systems for generating information on appropriate use of inputs, management of pests and diseases, and for developing strategies to manage aberrant weather conditions for improving crop production, the Indian Council of Agricultural Research (ICAR) launched All India Coordinated Research Project on Agrometeorology (AICRPAM ) during May 1983 with the Coordinating Unit at Central Research Institute for Dryland Agriculture (CRIDA), Hyderabad. Hitherto, the project has 25 cooperating centres under its umbrella in State Agricultural Universities (SAU’s) across the country in different agroclimatic regions. The cooperating centre of AICRPAM at Dr.Panjabrao Deshmukh Krishi Vidyapeeth, Akola (Maharashtra), Dryland Agriculture Research Project, started in 1995. |
 |
Mandate |
|
Agroclimatic Information |
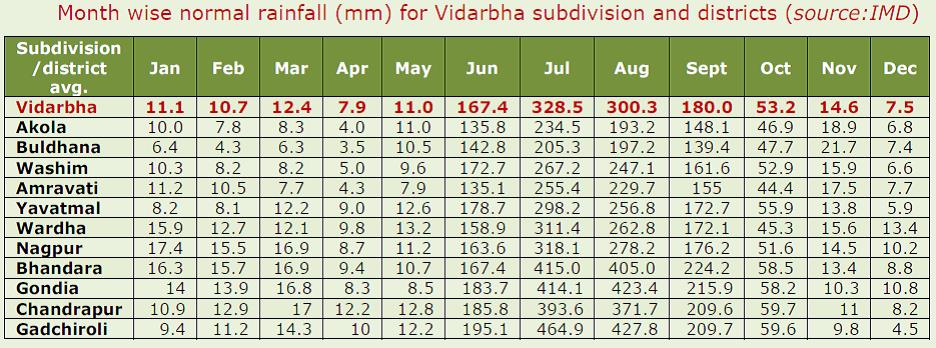
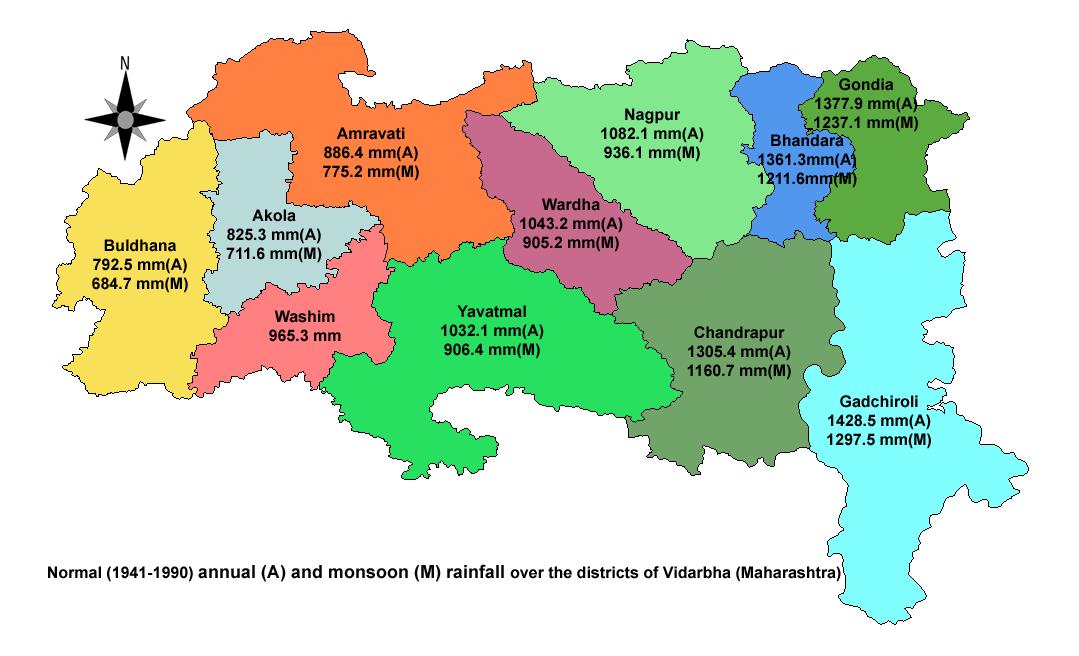
| The jurisdiction of Dr. Panjabrao Deshmukh Krishi Vidyapeeth, Akola is entire Vidarbha region which is located in eastern Maharashtra and comprises eleven districts viz. Buldana, Akola, Washim, Amravati, Yavatmal, Wardha, Nagpur, Bhandara, Gondia, Chandrapur and Gadchiroli. It lies in between 170 57’ – 210 46’ N Latitude and 750 57’ – 800 59’ E Longitude having total geographical area of 97.23 lakh ha which is 31.61% of Maharashtra. Forest cover is 26.86 lakh ha (28%).The region is agro-climatically heterogeneous and geographically much of this central Indian region is in the rain shadow area with around 90% of area under rainfed farming. The region is classified under agroclimatic zones (NARP) viz. Central Vidarbha (AZ-97) and Eastern Vidarbha (AZ-98). As per planning commission, districts of Akola, Washim, Buldhana, Amravati, Yavatmal,Wardha and Nagpur fall under agroclimatic zone – western plateau and hills region whereas as Bhandara, Chandrapur, Gondia and Gadchiroli districts fall under eastern plateau and hills region. Annual rainfall varies from 700 to 950mm in the western parts to more than 1250mm in the eastern parts. Normally the southwest monsoon sets in from 11th June and active monsoon rains commence during 18th-25th June. Rains are mostly received from South-West monsoon during June to September. Post monsoon and winter rains during October to February are uncertain. The highest rainfall occurs during July and August. However, rains are meagre after first fortnight of September with withdrawal occurring by first week of October. Total rainy days range in between 47 to 65. The coefficient of variation of monthly rainfall is 40 to 50 per cent even for the wettest month i.e. July indicating the uncertainty of rains during the season with scarcity and semi-scarcity conditions. Critical dry spell occurs across from second week of July, second/last week of August or first week of September with duration of 15-25 days. Generally agricultural drought occurs once in four years. |
 |
 |
| The region experiences sub-humid to humid conditions in monsoon season, semi-arid in winter season and arid in summer season. Hot summer and moderately cool winter characterize the Vidarbha region. Cold wave with moderate intensity at least once or twice is the characteristics of winter. Vidarbha region has a net cultivated area of 49.71 lakh hectares with 10.97 lakh ha being cultivated for more than once due to irrigation facilities (14.08%) or favorable weather conditions. Agriculture in the region is mainly rain dependent and is a challenged area. Most of the area under nutritious cereals (87%), pulses (98%), oilseeds (99%), and cotton (99%) is rainfed. |
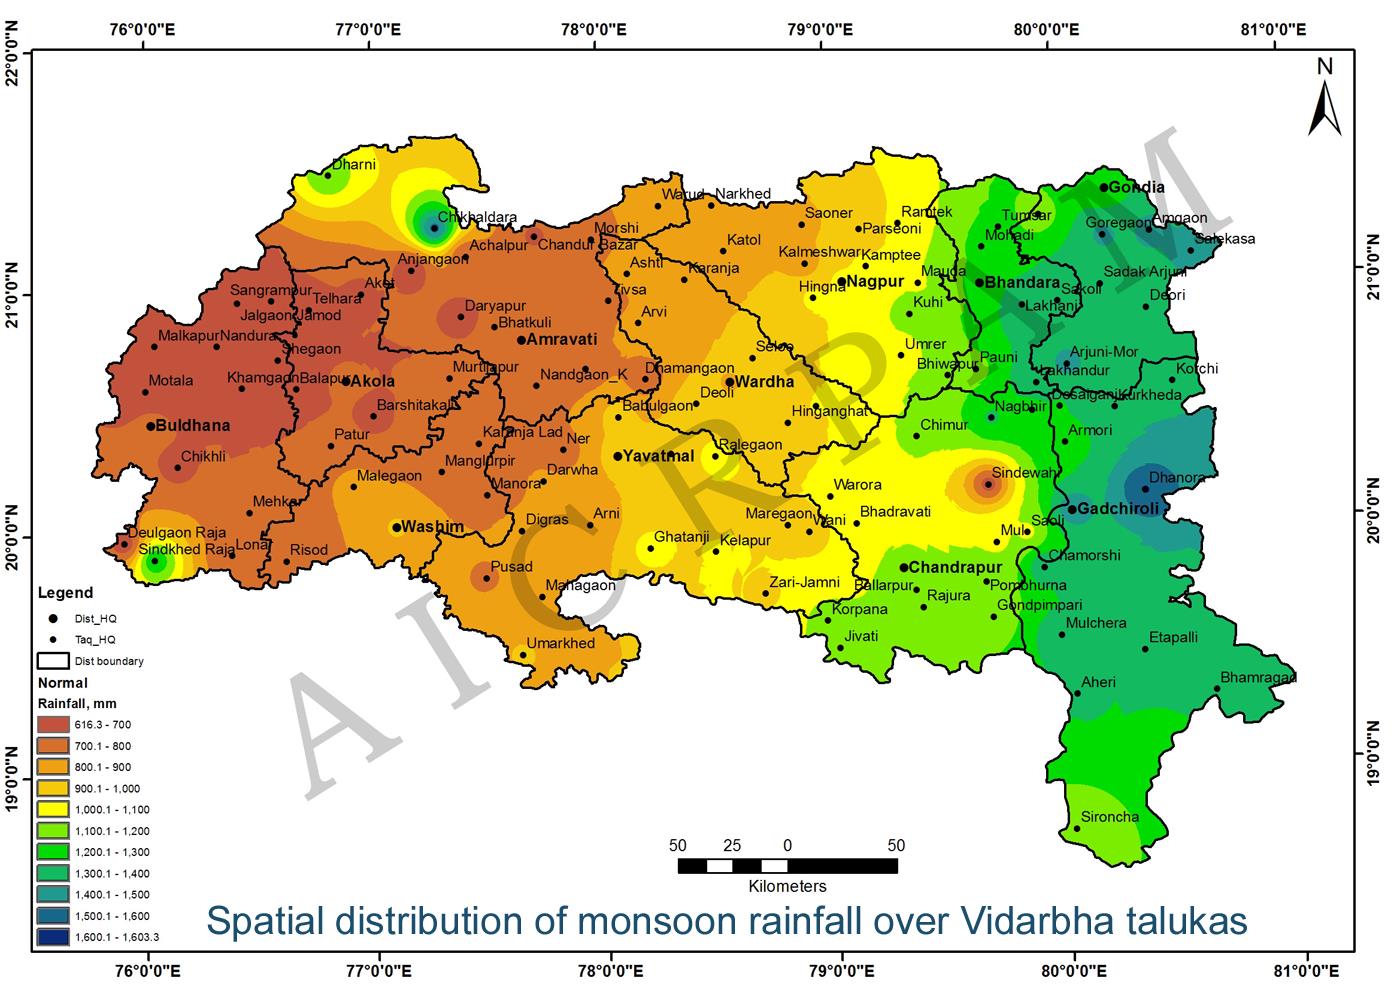 |
| The normal monsoonal rainfall in Vidarbha region taluka wise varied from 623 mm (Shegaon-Buldana district.) to 911 mm (Washim)/1527 mm(Chikhaldara-Amravati district) in western Vidarbha , in the central Vidarbha it varied from 760 mm(Ner-Yavatmal district) to 1155 mm (Kuhi/Biwapur-Nagpur district). In Eastern Vidarbha it varied from 1046 mm (Bhadravati-Chandrapur district) to 1603 mm (Dhanora-Gadchiroli district) (Data source: Department of Agriculture, Govt. of Maharashtra). |
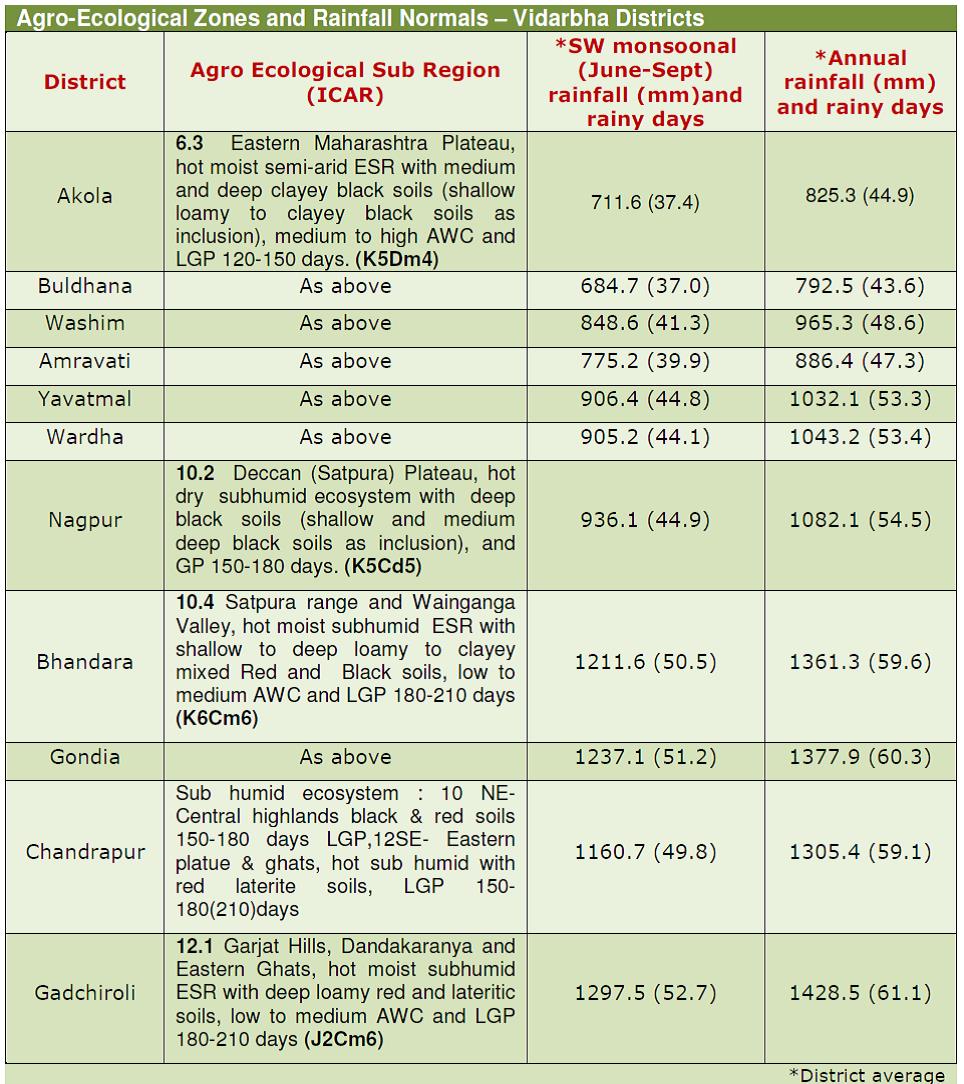 |
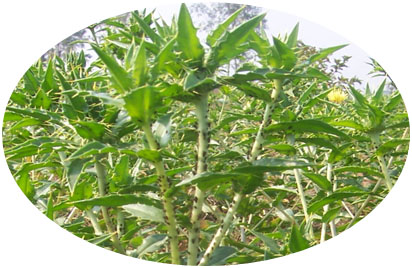
| Akola, AICRPAM project cooperating centre, is located in Eastern Maharashtra Plateau at 20042’ N Latitude, 77002’ E Longitude and elevation of 305 m amsl (elevation at Agromet observatory). The region is classified as hot moist semi-arid climate with medium and deep clayey black soils (shallow loamy to clayey black soils as inclusion), medium to high AWC and LGP of 120-150 days. Akola centre receives an average (1971-2000) annual rainfall of 811 mm in 43 rainy days. The average rainfall during monsoon season (June to September) is 687 mm and ranges from 352 to 1155 mm. Peak rainfall occur during 2nd week of August. Day temperature varies from 28.90C (1st week of January) to 42.70C(2nd week of May), while night temperature varies from 10.20C (3rd week of December) to 27.50C (3rd week of May to 1st week of June). The mean daily relative humidity during monsoon, winter and summer is 73, 54 and 36 percent, respectively. The atmospheric relative humidity at the evening hours is as low as 8 per cent during severe hot days of summer. The rate of evaporation reaches up to 25.4mm per day during May. The wind speed reaches to 35.3 km per hour during the same month. There is sufficient dew deposition in the winter season, which starts from September and continues up to first fortnight of January. Seasonal dew deposition ranges between 3 and 7mm with the total dew night range as 40 to 100. The major crops grown in the region are cotton, soybean, pigeonpea, green gram and black gram during kharif season and chickpea, safflower and sunflower during rabi season. |
| Agroclimatic Constraints for Agricultural Production |
|
| Research Activities and Achievements |
| The AICRPAM project has done significant work in the areas of agro-climatic characterization, crop weather relationships, weather-crop insect-pest and disease interactions and regional climatic variability. |
| Agroclimatic characterization | |
| Rainfall characterization was carried out for Vidarbha zones. The eleven districts of Vidarbha region are grouped under western, central and eastern zone.
|
|
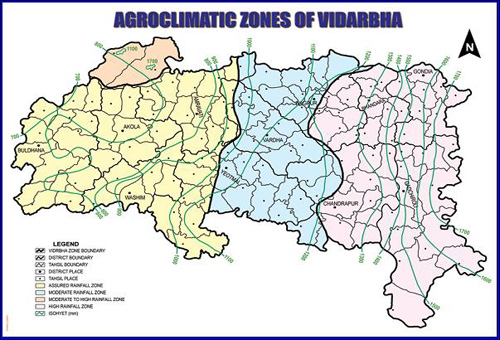
| i) Assured rainfall zone
It covers about 33 per cent of Vidarbha. It includes entire Buldana and Akola district and parts of Washim, Amravati and Yavatmal district. The isohyets range from 650 to 700 mm on the western side to 900 mm on eastern side with coefficient of variation as 25 per cent. Total number of rainy days range from 42 to 54. Average rainfall over the zone is 754 mm with 48.7 rainy days. Monsoon rains (June-September) amounting to 659 mm account for 87% of annual rainfall, winter (October-January) 7.3% and summer (February-May) 5.7%. Mean maximum temperature of monsoon, winter and summer seasons are 33.0, 31.2 and 37.9OC, respectively. The corresponding values of mean minimum temperature are 24.0, 16.0 and 20.0OC. The records of extreme highest and lowest temperature are 48.5 and 1.0OC, respectively. ii) Moderate rainfall zone It covers entire Wardha district, most parts of Yavatmal , Nagpur district excluding eastern part and western part of Chandrapur district. The isohyet range is 900mm towards west and up to 1250mm towards east. Total number of rainy days is 52 to 62. Average rainfall over the zone is 962 mm with 57.7 rainy days. Monsoon rains amount to 829 mm and account for 86% of the annual rainfall, whereas the winter and summer take the share of 9.2 and 4.8%, respectively. Mean maximum temperatures of monsoon, winter and summer are 31.8, 29.3 and 37.9OC, respectively. The corresponding minimum temperature values are 23.6, 16.4 and 22.5OC, respectively. iii) Moderately high rainfall zone It is the smallest zone restricted to hilly areas of Satpuda ranges covering only Dharni and Chikhaldara tahsils of Amravati district. The mean annual rainfall is 1076 mm in Dharni and 1460 mm in Chikhaldara district which is received in 56 to 77 rainy days, respectively. The entire area has higher altitude with predominant forest. Monsoon rainfall is 1006 and 1337mm in Dharni and Chikhaldara, respectively, which comes to 93 and 92% of annual rainfall. It has a higher coefficient of variation. Average maximum temperatures of monsoon, winter and summer are 31.8, 29.3 and 37.0OC, respectively. The corresponding minimum limits are 29.6, 16.4 and 22.5OC, respectively. iv) High rainfall zone This zone includes entire Bhandara, Gondia and Gadchiroli districts; Chandrapur district excluding western part and Nagpur district excluding its eastern part. The isohyet limits are 1250 mm on the western side to 1750 mm on the extreme eastern side. The total number of rainy days range from 59 to 75. Average rainfall over the zone is 1500 mm with 66.9 rainy days. Monsoon rainfall is 1313 mm (88%). Winter and summer rainfall accounts for 7.0 and 5.0%, respectively. Mean rainfall during October is 56.8 mm which promotes rabi crops in this zone. February rains are 26.6 mm which again help the rabi crops.The mean maximum temperatures for monsoon, winter and summer seasons are 31.0, 29.3 and 37.0 OC, respectively. The corresponding values of minimum temperature are 24.0, 15.0 and 21.0 OC. |
|
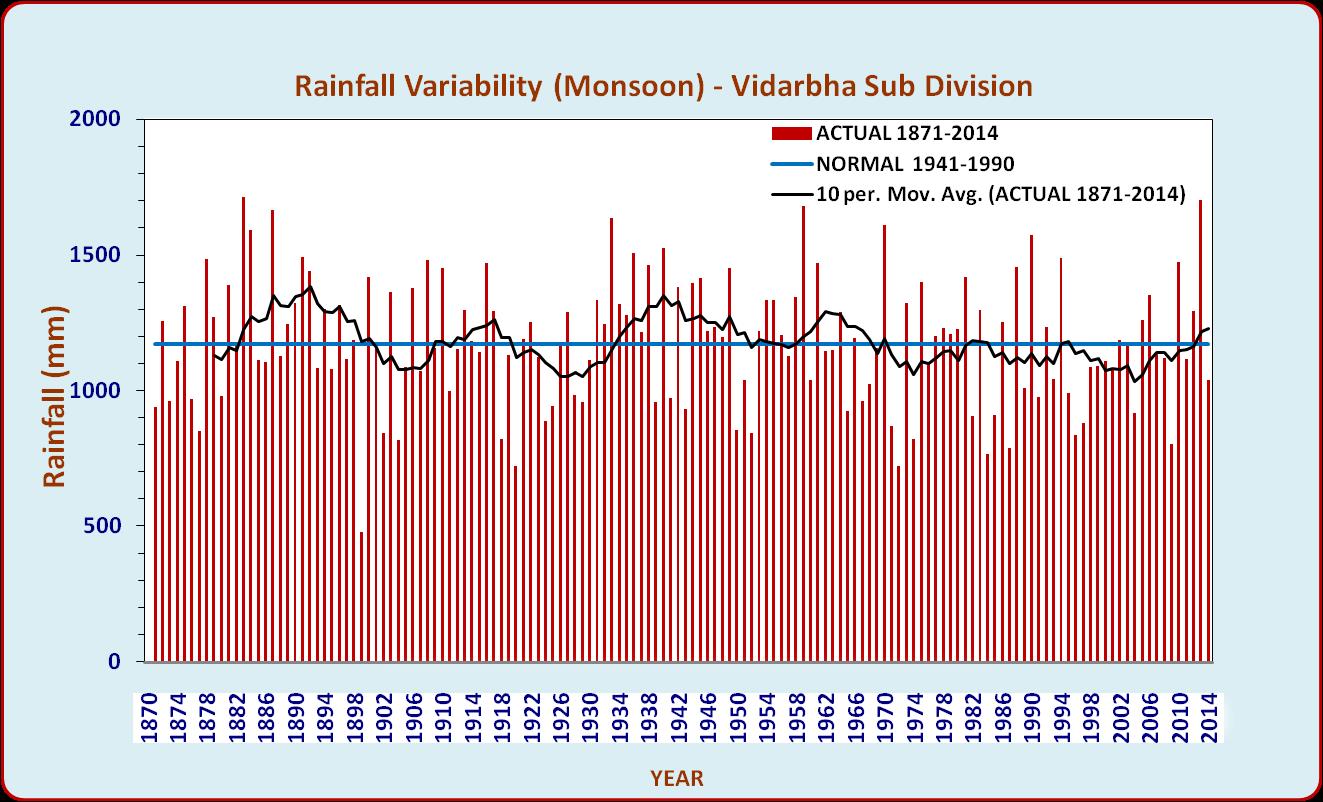
| Long term rainfall trend in Vidarbha region | |
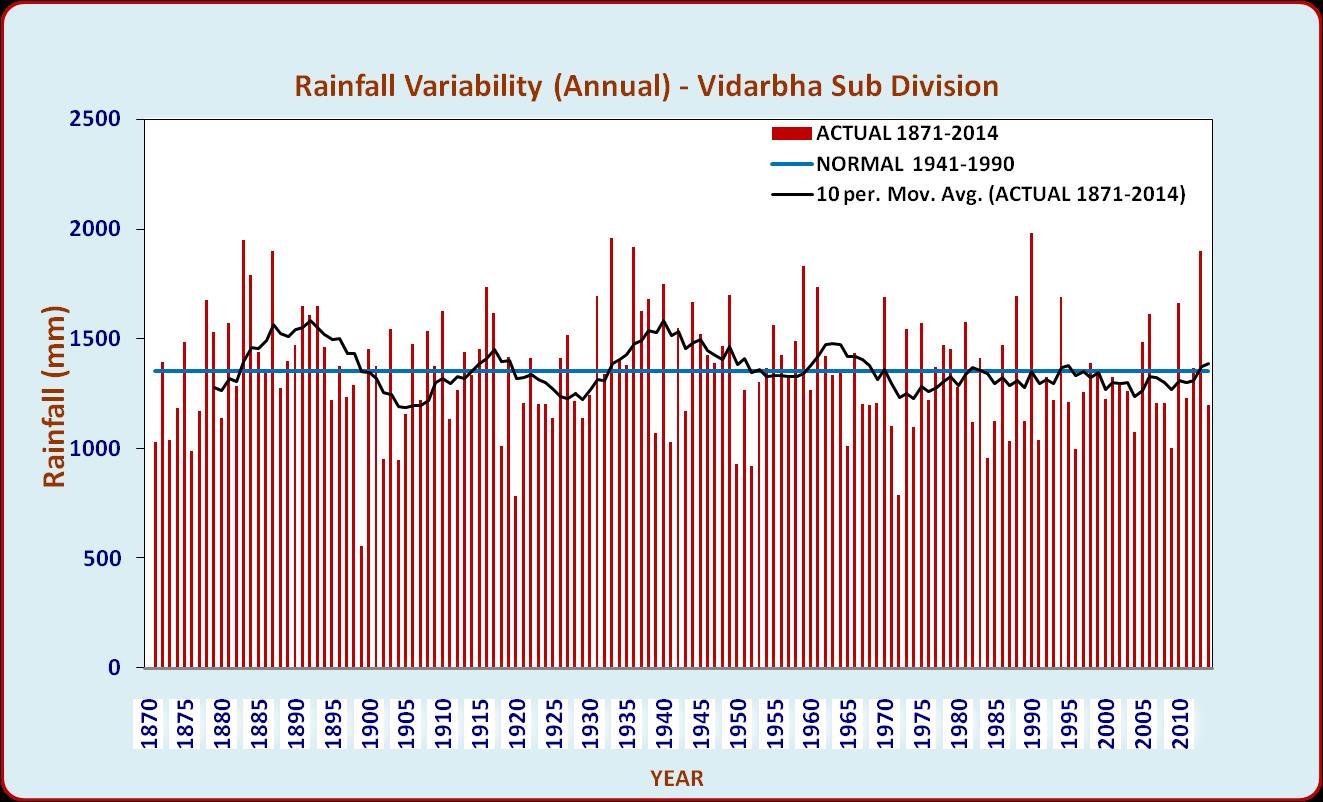
| Long term (1871-2014) rainfall data (source: IITM, Pune) of Vidarbha subdivision was analysed for identifying long term trends and short term variability in the time series. Ten year moving averages of annual and southwest monsoon season’s rainfall over 144 years showed cyclic pattern with short period increasing and decreasing trend upto 1965 and later both annual and seasonal rainfall values dipped below the long term average. | |
 |
|
 |
|
| Spatial variability of rainfall | |
Analysis of 46 years annual and seasonal rainfall(1971-2016) of three locations in Vidarbha region representing its 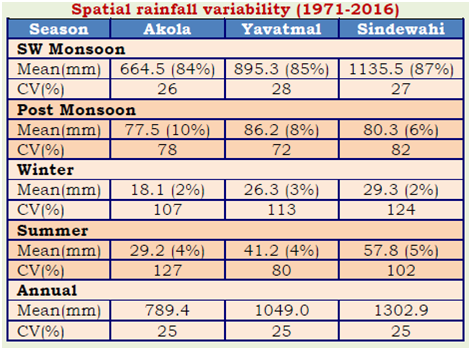 western region (Akola), central region (Yavatmal) and eastern region (Sindewahi) showed that both annual and monsoon season rainfall are highest in eastern region and lowest in western region. The annual rainfall decreases from 1303 mm in east to 1049 mm in the middle to 789 mm in the west. Similar pattern is observed in case of rainfall during southwest monsoon season and it is lesser by 471 mm in the west compared to east. However the coefficient of variability (CV) was nearly same across all the region. Among the seasons, rainfall during rainy season was least variable and rainfall during summer and winter seasons were highly variable in all the regions. western region (Akola), central region (Yavatmal) and eastern region (Sindewahi) showed that both annual and monsoon season rainfall are highest in eastern region and lowest in western region. The annual rainfall decreases from 1303 mm in east to 1049 mm in the middle to 789 mm in the west. Similar pattern is observed in case of rainfall during southwest monsoon season and it is lesser by 471 mm in the west compared to east. However the coefficient of variability (CV) was nearly same across all the region. Among the seasons, rainfall during rainy season was least variable and rainfall during summer and winter seasons were highly variable in all the regions. |
|
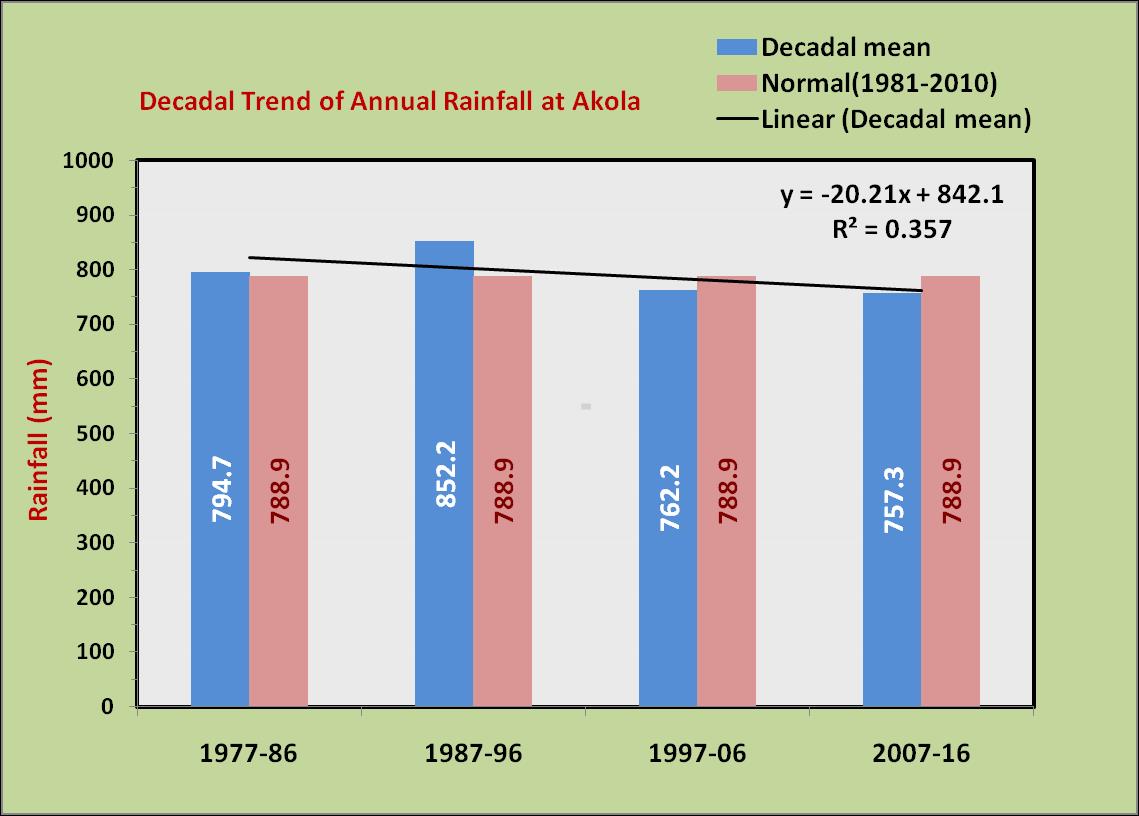
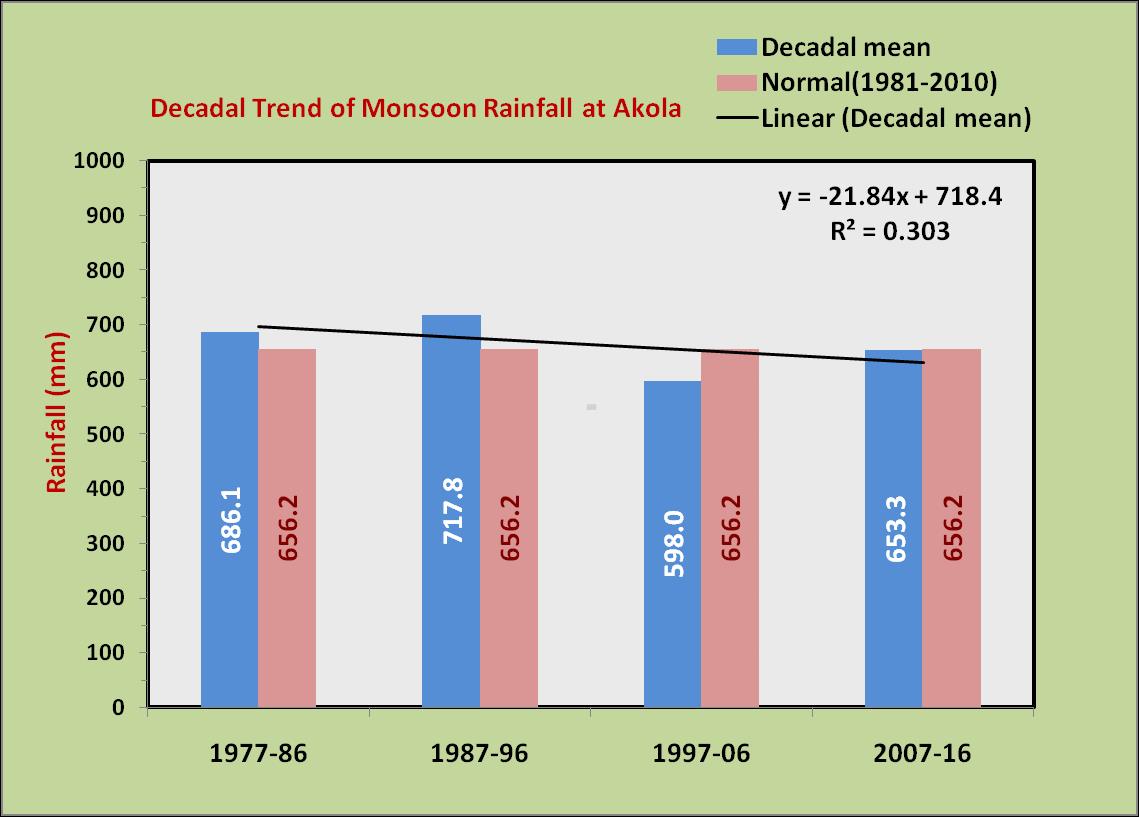
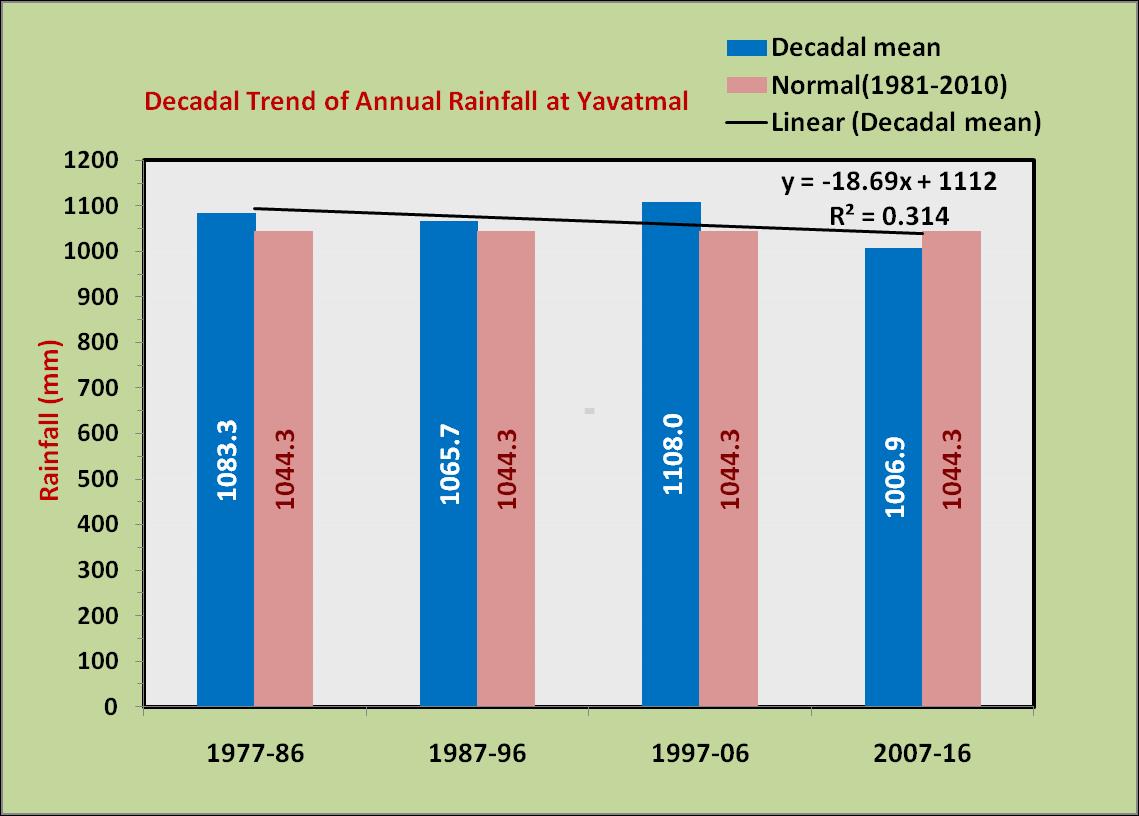
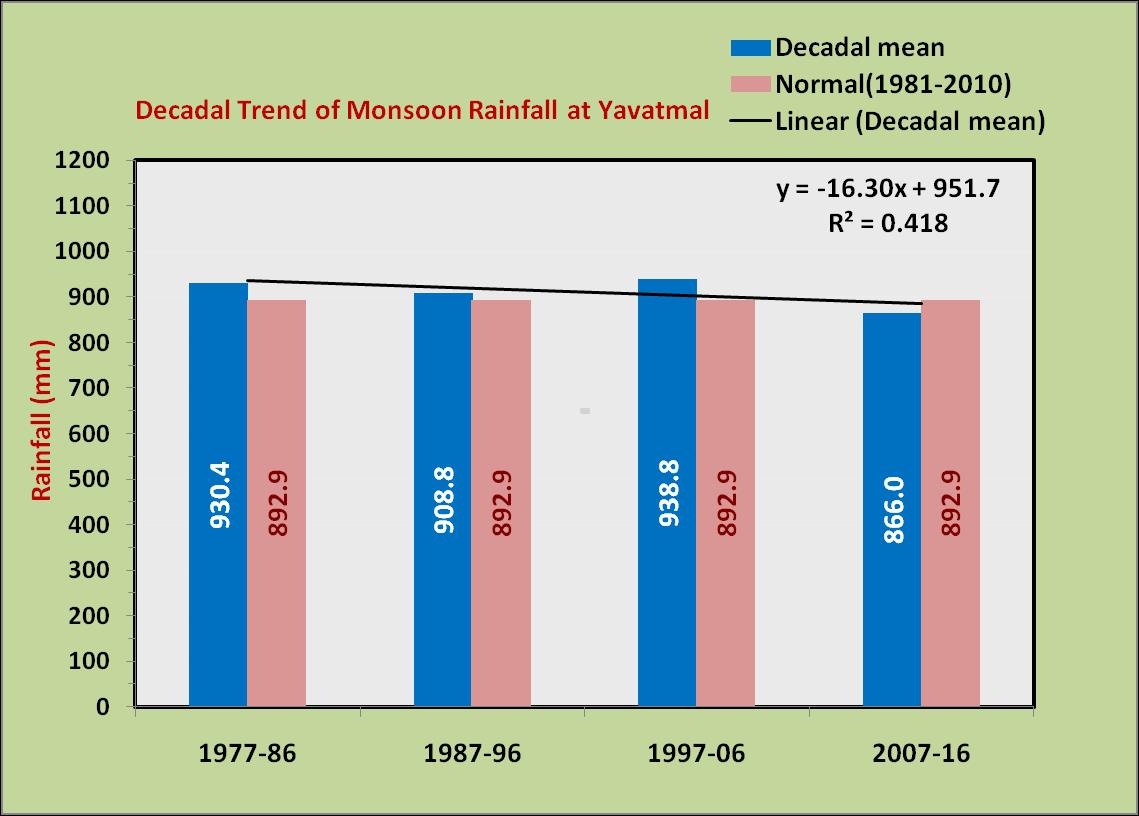
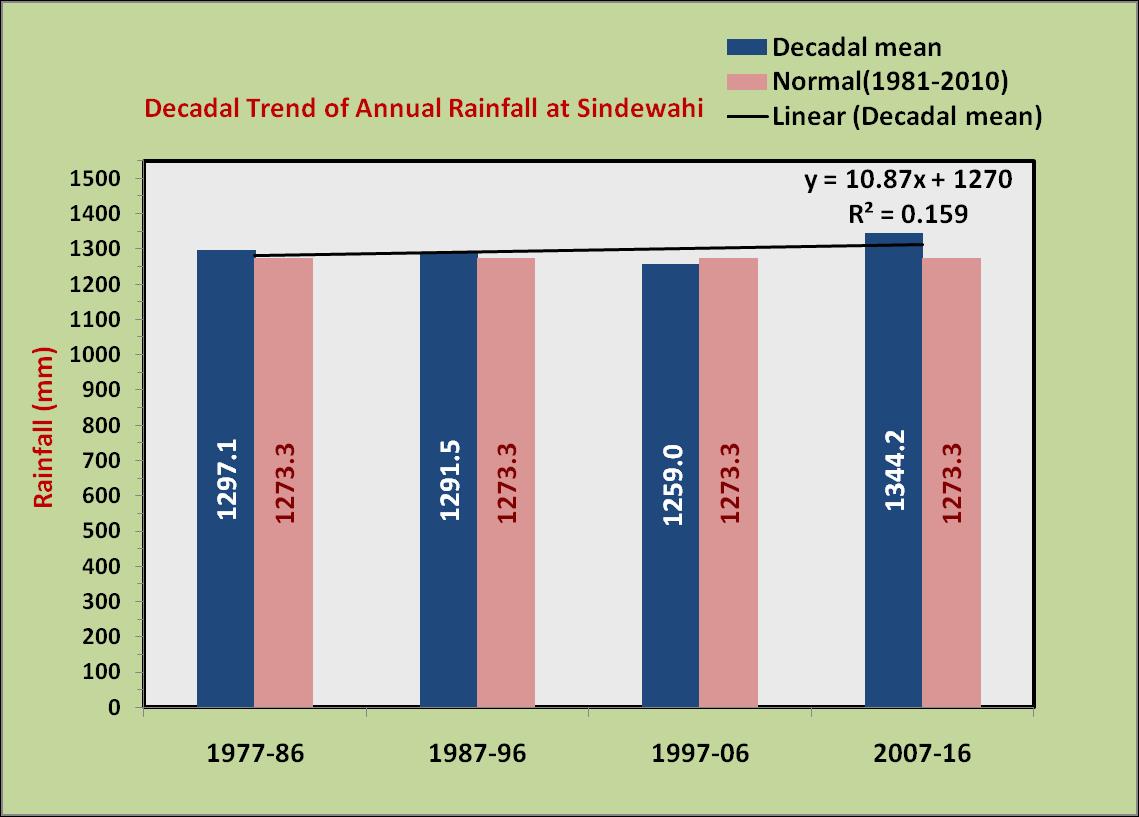
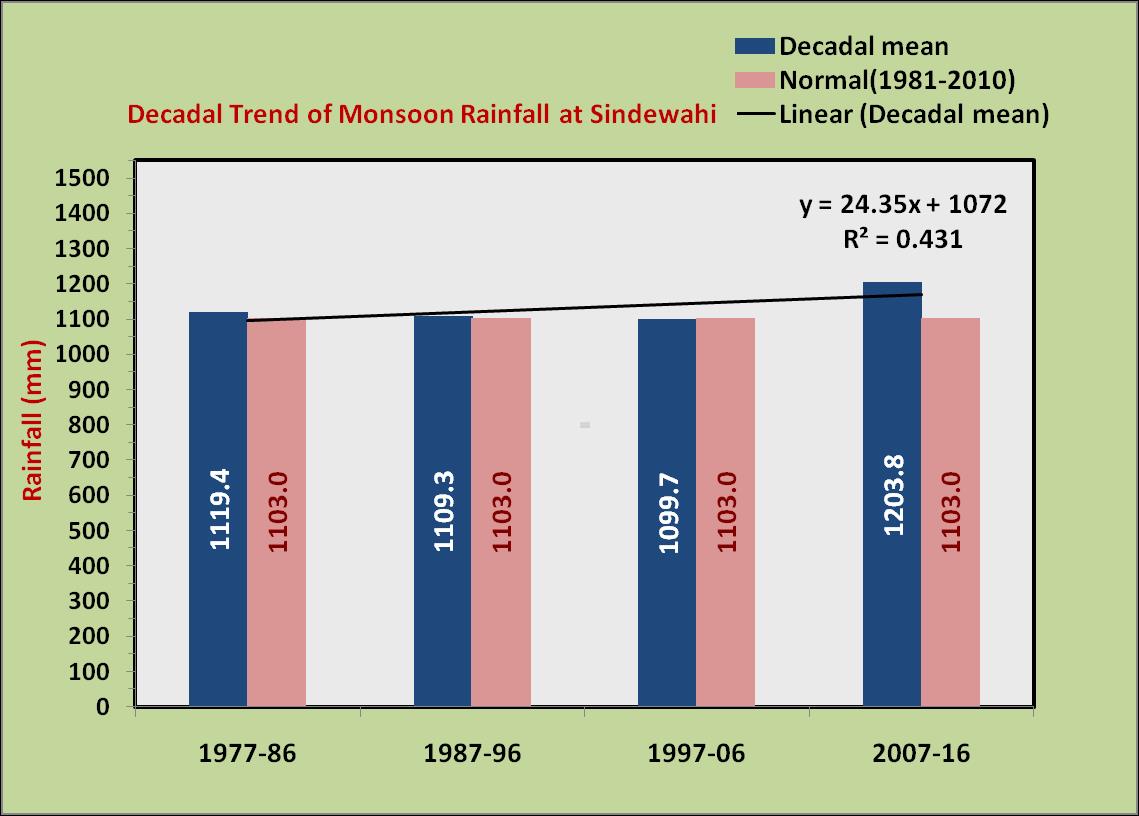
| Decadal changes in rainfall at three Vidarbha locations | |
| Decadal averages of rainfall over the past four decades at Akola(western region), Sindewahi(eastern region) and Yavatmal (central region) showed that decadal changes in rainfall are not similar across all three locations. Akola and Yavatmal witnessed declining linear trend of decadal average annual and monsoonal rainfall from the decade 1977-86 to 2007-16 while Sindewahi showed increasing linear trend of annual and monsoonal rainfall. At Akola and Yavatmal average annual and monsoonal rainfall declined by 20 and 22 mm per decade in Akola and 19 and 16 mm per decade at Yavatmal. Sindewahi showed 11 and 24 mm increase in annual and monsoonal rainfall per decade across 1977-86 to 2007-16. | |
 |
 |
 |
 |
 |
 |
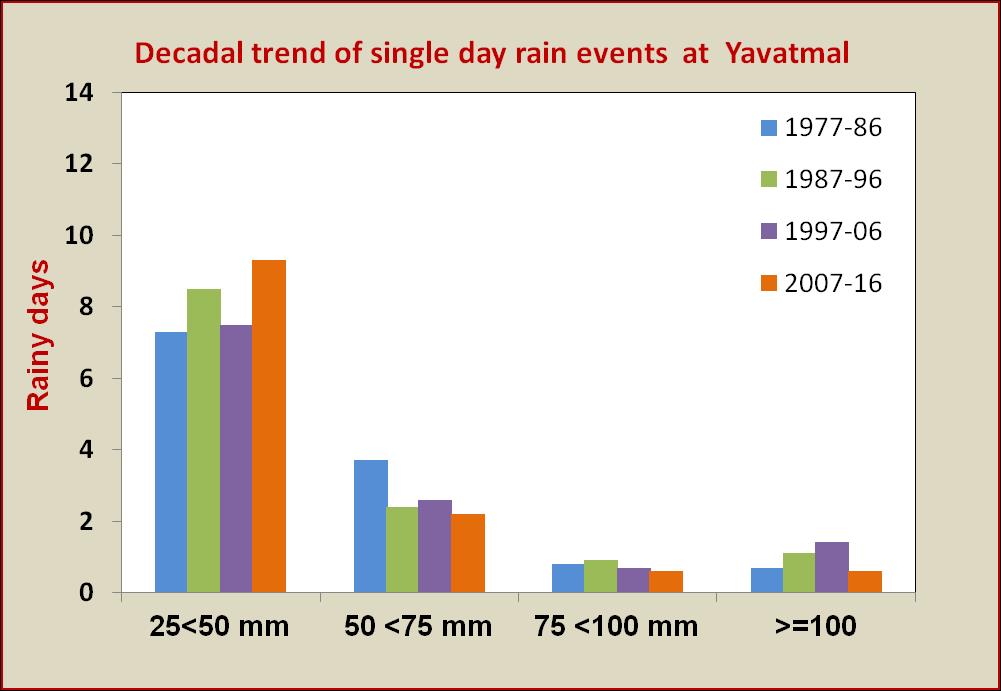
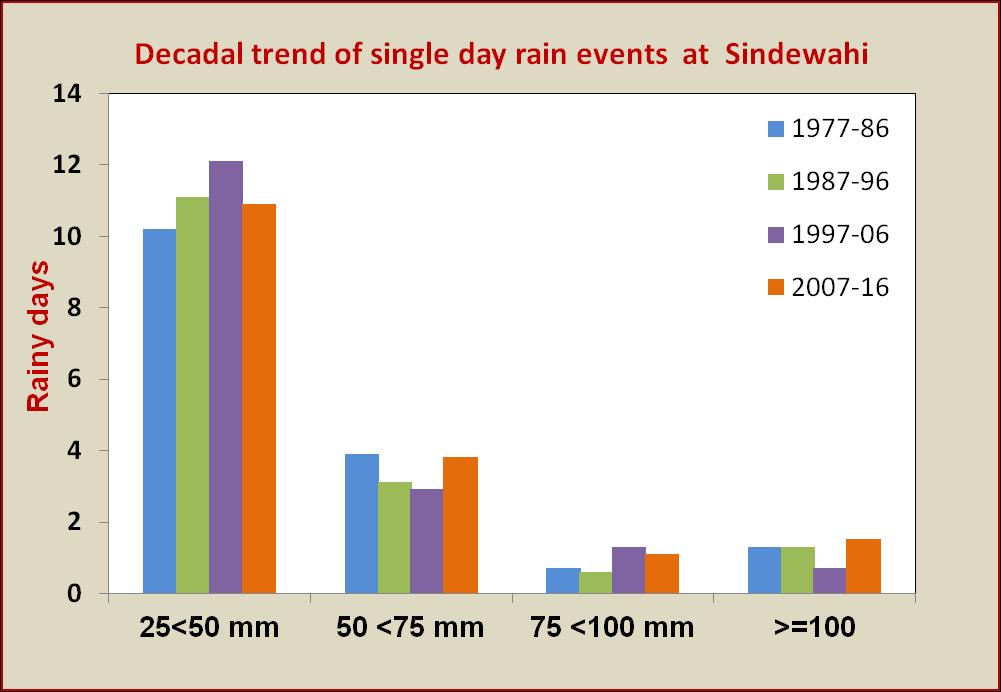
| Extreme rainfall events | |
| Contrary to the observations of increase in rainfall extremes in the recent decades across the country due to climate change, high rainfall events of 75-100 mm and more than 100 mm are generally showing decreasing trend across decades at Akola and Yavatmal. Sindewahi showed cyclic trend. | 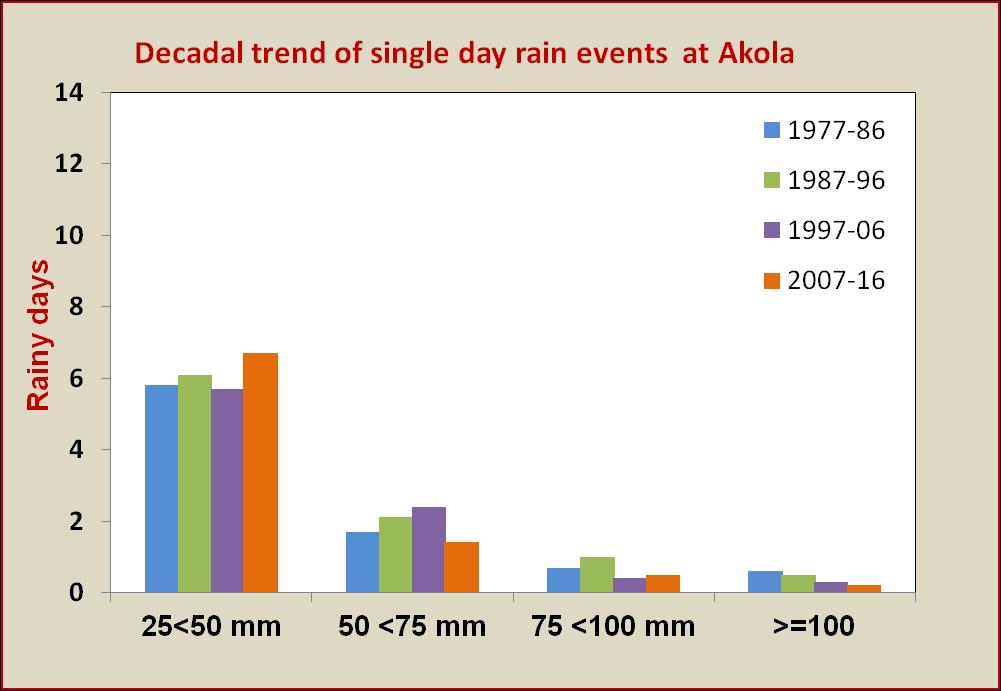 |
 |
 |
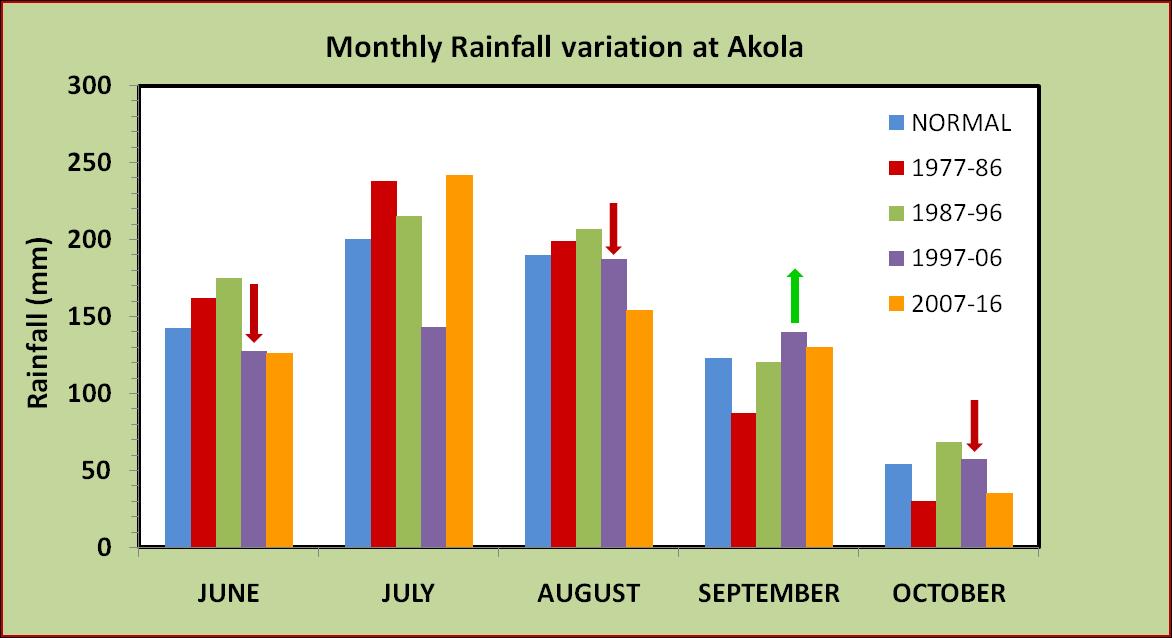
| Monthly rainfall variation at Akola | |
 |
|
| Monthly rainfall variation analysis of Akola indicated a decrease in June, August and October rainfall in the last two decades (1997-06 and 2007-2016) and increase in September rainfall during the same period. July rainfall showed cyclic trend across the decades (1977-86 to 2007-16). | |
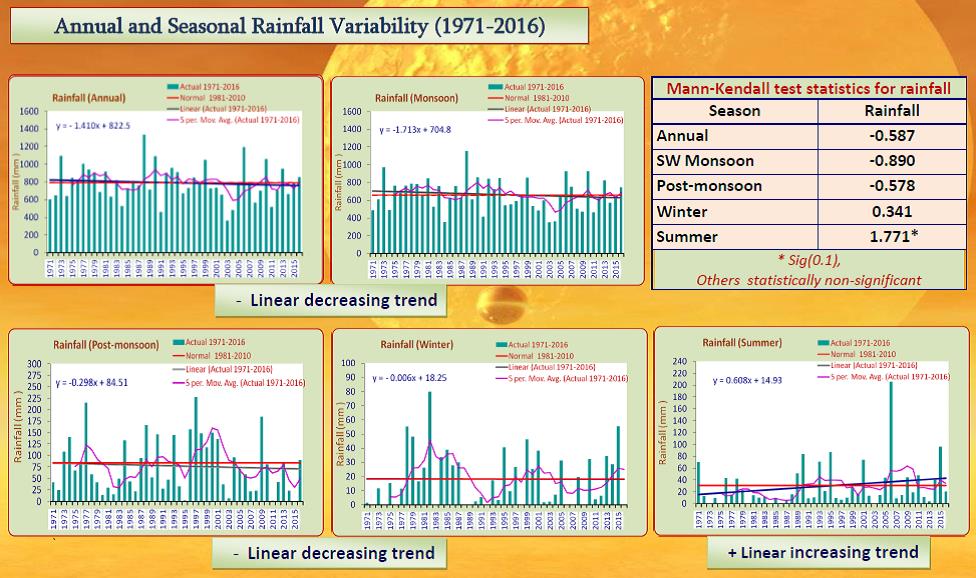
| Rainfall variability analysis (1971-2016) in different seasons of Akola | |
| Rainfall trends in summer season exhibited linear significant increasing trend, while monsoon, post monsoon and winter season showed linear non-significant decreasing trend across the period 1971-2016. | |
 |
|
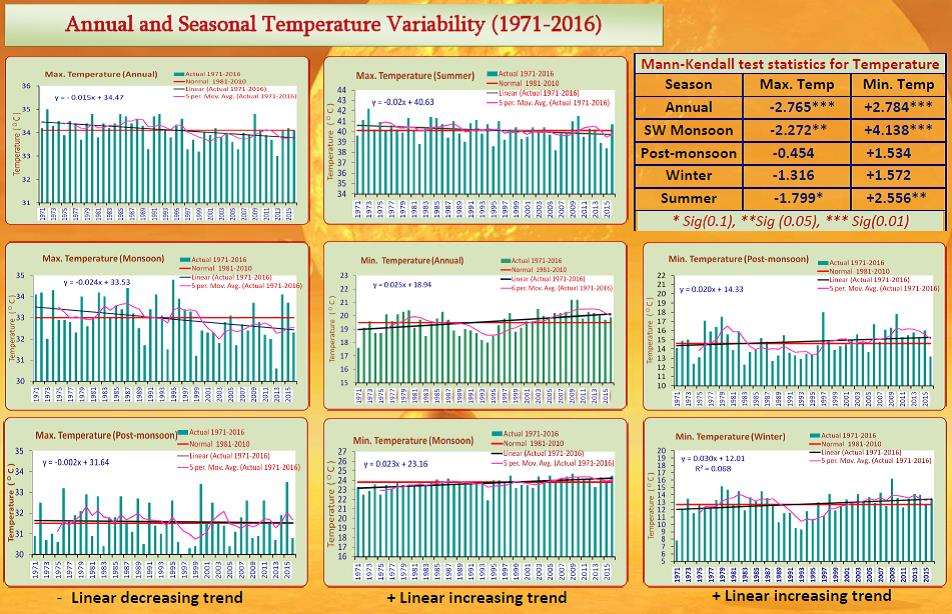
| Temperature variability analysis (1971-2016) in different seasons of Akola | |
| Annual maximum temperature showed declining trend of 0.0150C per year while minimum temperature showed an increasing trend of 0.0250C per year. Maximum temperature showed significant decreasing trend whereas minimum temperature showed significant increasing trend all through annual, SW monsoon and summer seasons. | |
 |
|
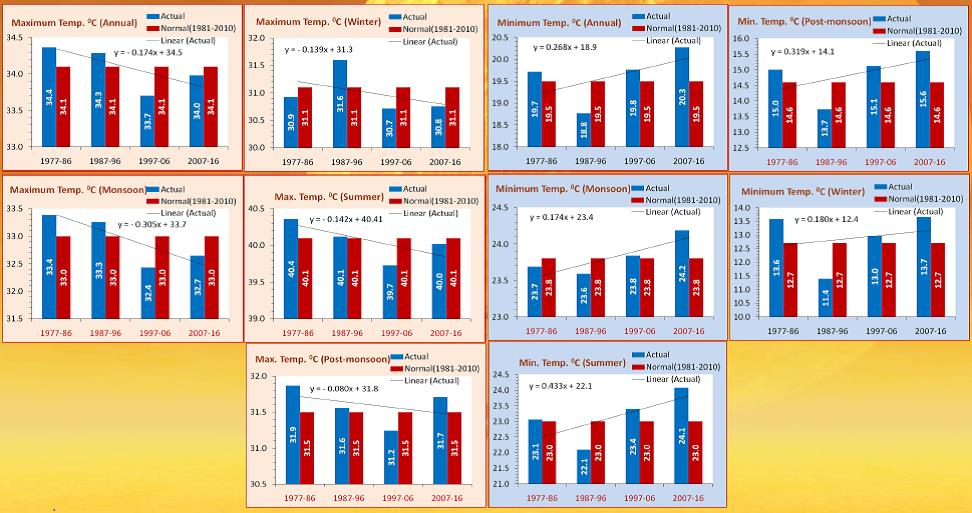
| Maximum temperature across the four decades (1977-86 to 2007-16) showed linear decreasing trend whereas minimum temperature showed upward trend both annually and seasonal basis. | |
 |
|
|
|
| Crop Weather Relationship | |
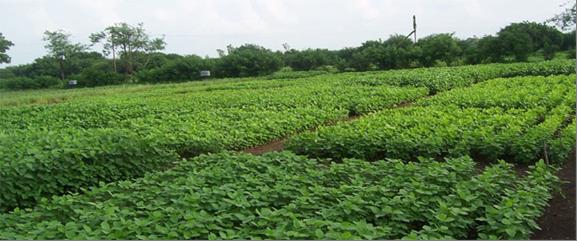
| Detailed phenology and thermal requirement of soybean at different growth stages were quantified. Earliest growing environment of 26 MW sowing attained physiological maturity in 99 to 103 days in different cultivars. Maturity period decreased by 10 to 11 days with sowing delayed up to 29 MW. GDD to reach maturity were more with 26 MW sowing (1700 to 1800°C day) and it decreased by about 100 °C day under late sown crop (29 MW sowing). GDD based model to predict phenology performed with an accuracy of -1 to -2 days for anthesis day, first pod day and first seed day and +2 to +4 days to predict maturity. Normally the growing environment of 26 to 27 MW sowings more or less ensures optimum growing conditions in terms of the most influential weather parameters viz., temperatures (maximum and minimum) and rainfall. Regression models were developed to predict seed yield of soybean based on temperature and rainfall. Weather variables during different crop stages and growing environment revealed that highest seed yield could be realized with early sowing (26 MW) than delayed sowing conditions due to prevalence of higher rainfall (200 mm), minimum temperature (23.0 to 23.1°C), photoperiod (day length) hours (498 to 518 hrs) and lowest maximum temperature (31.2 to 31.4 °C) and DTR (8.1 to 8.4 °C) during pod formation to seed fill stage, the most critical phenophase of kharif soybean. Crop water use, water requirement satisfaction index, and water productivity also decreases with later sowings. | |
 |
|
|
|
|
 |
|
|
|
|
|
|
|
|
|
|
|
|
|
|
|
|
| Contact Information | |
| Dr. A. R. Tupe Agrometeorologist, AICRP on Agrometeorology Dr.Panjabrao Deshmukh Krishi Vidyapeeth Akola-444104 (Maharashtra) Phone: (91)-(0724) 2258115, 2258569 Fax:(91)-(0724) 2258569 |
|
 incidence is controlled by temperature (maximum and mean) of the preceding 2 to 3 weeks. Relative humidity (instant and lag) was found to encourage the buildup of semilooper population. Thus, lower temperatures and high humid conditions are congenial for semilooper incidence and development in soybean. Relation with minimum temperature showed that pest had a narrow range of night time temperatures but fluctuates widely with day time temperatures. Maximum temperature in the range of 30 to 31 °C, minimum temperature 23 to 24 °C, morning relative humidity of 91 to 92% and evening relative humidity of 62 to 63% were found congenial for peak semi looper population in soybean.